The potential impact of the new Omicron Covid strain is yet to be established, but that uncertainty has shaken up global markets. Last week’s sell off in equities was followed by a Monday morning bounce. While the next move is yet to be confirmed, technical indicators in the Nasdaq index remain bullish and point to an opportunity to buy the dips.
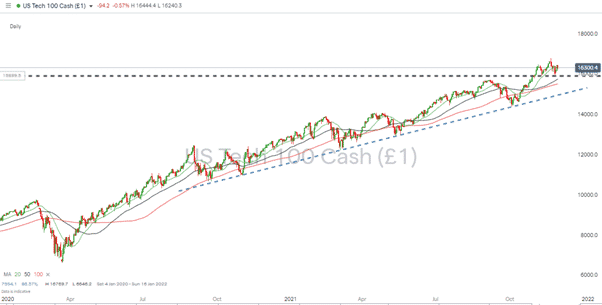
Nasdaq 100 – Daily Price Chart and Technical Indicators

Source: IG
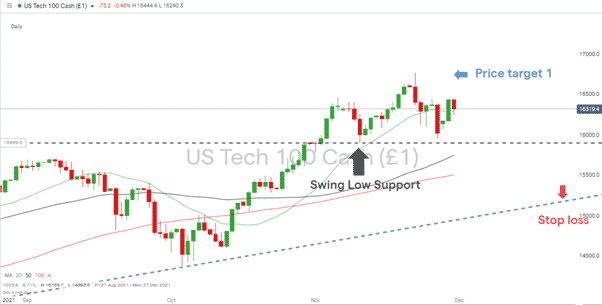
Nasdaq 100 – Strong Short Term Technicals
Short-term Technicals remain bullish. The swing low support of 10th November (15,905) held firm despite Friday’s sell-off, and while that stays in place, it’s hard to look past the eternal appeal of the Nasdaq’s higher highs and higher lows. The 20 Day SMA is also offering support. This key indicator was breached during the recent sell-off, but price had recovered to trade above it by Monday evening.
A downward break of the 20 Day SMA would be a significant concern and a break of the support at 15,905 even more so. To the upside, the first price target is set at the all-time high of 16,769 of the 22nd November, but how soon that will be tested is a good question as prices after European exchanges opened on Tuesday were still 2.79% off that level.
The appeal for those looking to go long is that should the index print above 16,769, then the path of least resistance continues to be upwards. The tech heavy Nasdaq index is made up of relatively well-insulated firms against the worst aspects of a Covid resurgence. Some of the stocks in the index were ‘winners’ when the events of 2020 led to the world’s population changing their work and social habits and going digital.
Nasdaq 100 – Long Term Technicals
Stop losses on any long trade put on now would appear to naturally sit near the long-term supporting trendline, which has been in place for more than 12 months. With each additional bounce off the line, that support level confirms its dominant role as a technical indicator. Nothing is ever guaranteed in the markets, and it will have to break one day, but until it does, Nasdaq dips continue to be the gift that keeps on giving.
Nasdaq 100 – Daily Price Chart 2020 -2021 – With Supporting Trend Line

Source: IG
It’s also worth remembering the timing of the Omicron sell off. The news relating to cases in Southern Africa hit the markets during one of the biggest holidays in the US, Thanksgiving. With movers and shakers at home with their families, a lot of the selling pressure would have been triggered by systematic trading models catching wind of a change in market sentiment. A little human intervention and a reappraisal of the severity of the situation appears to have come into play, and the ever-enduring sense of FOMO for those not in tech stocks is never far away.
Crowdsourcing information about scam brokers can help others avoid falling into the traps set by disreputable brokers, and you can share your experiences here. If you want to know more about this particular topic or have been scammed by a fraudulent broker, you can also contact us at [email protected]
Related Articles
- Forex vs Crypto: What’s Better For Beginner Traders?
- Three Great Technical Analysis Tools for Forex Trading
- What Does Binance Being Kicked Out of Belgium Mean for Crypto Prices?
- Crypto Traders and Coin Prices Face New Challenge as Binance Gives up its FCA Licence
- Interpol Declares Investment Scams “Serious and Imminent Threat”
- Annual UK Fraud Audit Reveals Scam Hot-Spots
Forex vs Crypto: What’s Better For Beginner Traders?
Three Great Technical Analysis Tools for Forex Trading
Safest Forex Brokers 2025
| Broker | Info | Best In | Customer Satisfaction Score | ||
|---|---|---|---|---|---|
| #1 |
|
Global Forex Broker |

BEST SPREADS
Visit broker
|
||
| #2 |
|
Globally regulated broker |

BEST CUSTOMER SUPPORT
Visit broker
|
||
| #3 |
|
Global CFD Provider |

Best Trading App
Visit broker
|
||
| #4 |
|
Global Forex Broker |

Low minimum deposit
Visit broker
|
||
| #5 |
|
Global CFD & FX Broker (*Don’t invest unless you’re prepared to lose all the money you invest. This is a high-risk investment and you should not expect to be protected if something goes wrong. Take 2 mins to learn more) |

ALL-INCLUSIVE TRADING PLATFORM
Visit broker
|
||
| #6 |
|
Global Forex Broker |

Low minimum deposit
Visit broker
|
||
| #7 |
|
CFD and Cryptocurrency Broker |

CFD and Cryptocurrency
Visit broker
|
||
|
|
|||||
Forex Fraud Certified Brokers
Stay up to date with the latest Forex scam alerts
Sign up to receive our up-to-date broker reviews, new fraud warnings and special offers direct to your inbox


